The table node is used to connect a single table to a data source node. Unlike the Tables node, many nodes can be connected to a single data source, with each node representing a different table. A range of operations and functions can then be connected to any given table node to perform any required data cleansing or manipulation on the data set before loading it into a target.
Table nodes are a good option if your data set contains tables on which you need to perform any kind of data preparation; the alternative to the table node is the Tables node, which does not support data cleansing processes in the Data Flow. For more information, see Multi Tables in a Data Flow.
Adding Table nodes
There are two methods of adding Table nodes to the Data Flow:
Method 1: Click "Add Tables"
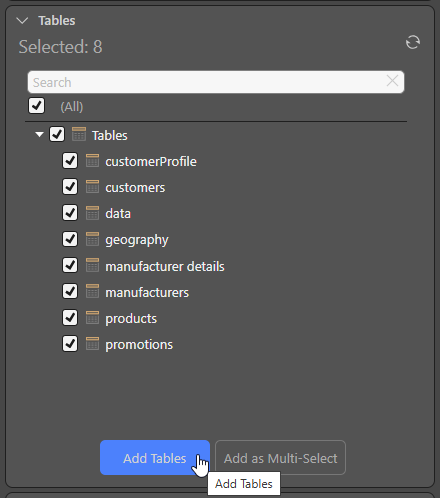
With the Source selected on the canvas, select all the required tables from the Tables section of the Properties panel and click Add Tables (as shown below):
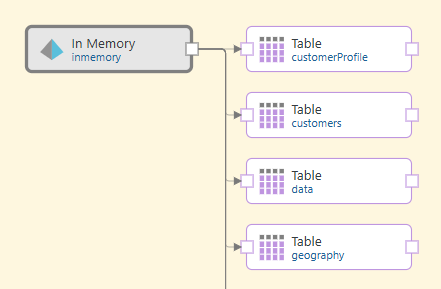
A Table node is created on the canvas for each of your selected tables:
Method 2: Drag Table nodes on individually
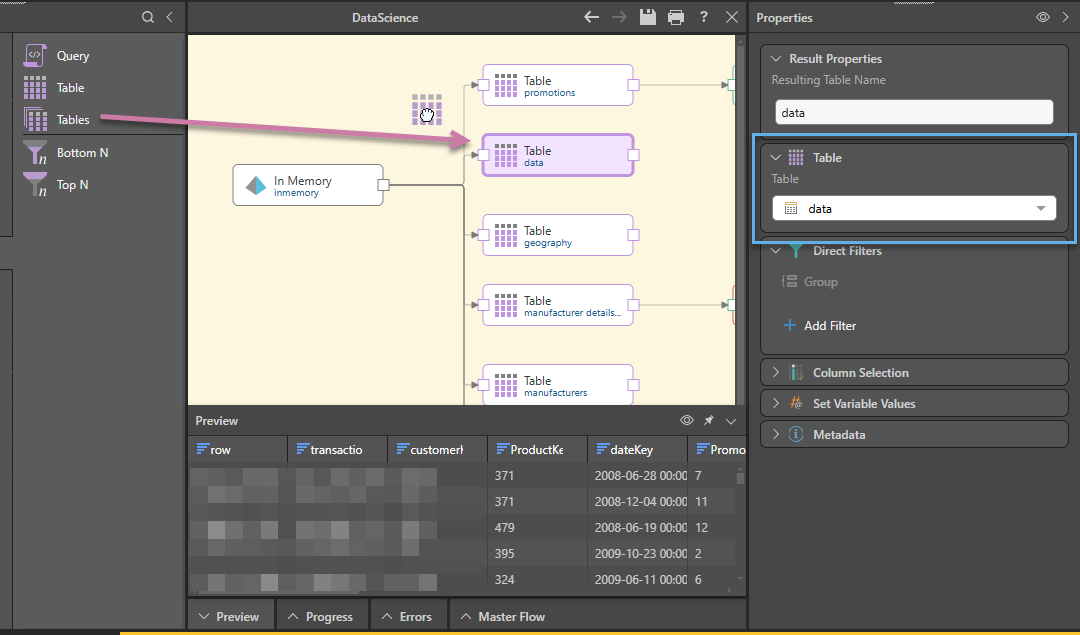
The second method requires you to add each Table node individually, connecting your nodes to the data source manually (purple arrow below), and then injecting the relevant table (blue highlight) into each Table node in the Properties panel. You can also rename the table from each node.
Additional options (not shown):
-
If the table includes value-based filters, you can select the Ignore value-based filters checkbox to remove those filters for the new model. This makes the entire dataset available for further analysis.
- If your data source is an Excel or Google Sheets spreadsheet, you should select the First row has column names checkbox if your source table includes a header row.
Preview Result Set
The result set of each table can be previewed by clicking on the relevant node, and then clicking the preview icon from the node's Properties panel or from the Preview panel. By default, the preview is limited to the first 50 rows, but this can be changed from the Preview Size dropdown list in the ribbon.
- Click here to learn more about the Preview panel.
Editing Table nodes (Properties panel)
To edit a Table node, select the node on the canvas (orange arrow below) and go to its Properties panel (purple highlight), where you can open the node's preview (green arrows) and reset the Table's various settings:
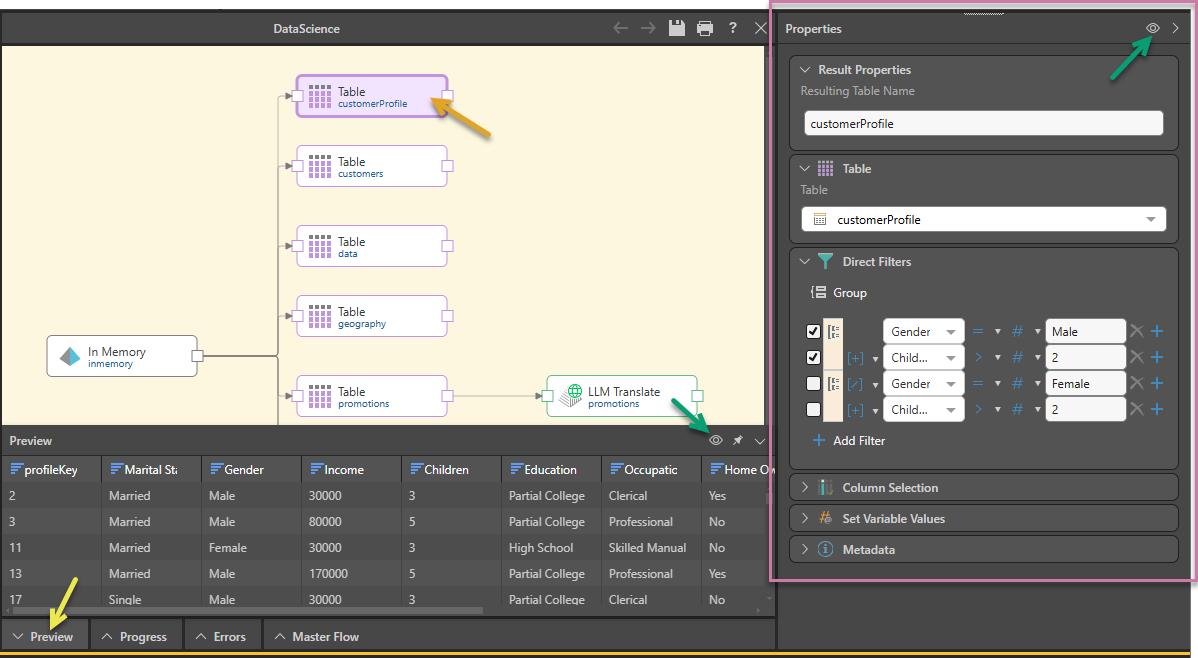
Tip: If your preview panel is closed, you can use the tabs along the bottom of the page to open it (yellow arrow above).
Result properties
The name of the table in the new data model. You can change the table name here if required.
Table
The table represented by the currently selected node. Select a different table from the dropdown list to change the table selection.
Direct Filters
Filter the table, limiting the content of the column to data that fulfills one or more Filter criteria. Each filter condition is created by selecting a column name and creating a comparison (equal to, greater than, and so on) between it and another column, variable, or value. For example, in the preceding image, the filters limit the customer profile data to include only customer profile data for male customers with two children or female customers with two children.
This option is not available where the data source is one of the file sources (for example, if your data source is Excel). For more information, see File Sources.
Tip: Alternatively, you can model your Filter using a Filter node. Filter nodes can be added from the Preparation elements and filter the data as part of the Data Flow. For more information, see Filter nodes in a Data Flow.
Note: The inline filter limits the query results, avoiding filtering after the query has been run.
To create a multi-value Filter:
- Click Add Filter (green arrow) either alongside an existing condition or under your current filters to create a new query condition:
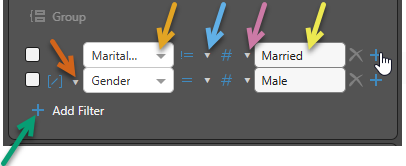
- In the new row, specify:
- The column name to be used as the operand for the filter (orange arrow above).
- The operator (blue arrow) for your condition. This can be one of equals, greater than, and so on.
- The type (purple arrow) for the second operand. This can be one of column (Table only), variable, or value.
- The value (yellow arrow) to compare your first operand to.
- Repeat as required, considering:
- If you add multiple conditions, they need to be "joined" to prior conditions using an OR or AND operator (brown arrow).
- You can, optionally, group multiple conditions to specify that two or more conditions must be treated as a single group (for example, if you want to use conditions to select customer data from Females over 5'6" OR males over 5'10", you need four conditions in two groups).
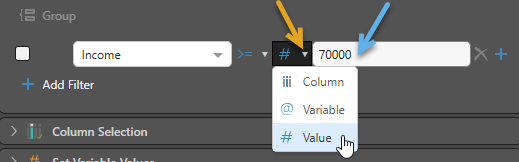
Second Operand
The second operand selected (blue arrow below) depends on the selected comparison type (orange arrow):
- (Table only.) If column is selected, you need to select a column from the dropdown list of all columns.
- If variable is selected, you need to select a variable from the dropdown list of all variables.
- If value is selected, you need to type the actual value manually into the text field.
Multiple conditions
Join conditions
- If multiple conditions are required, click on the + (plus) sign (purple arrow below) to add an additional query condition.
- Select AND or OR (yellow arrow) to determine how the two conditions should be joined.
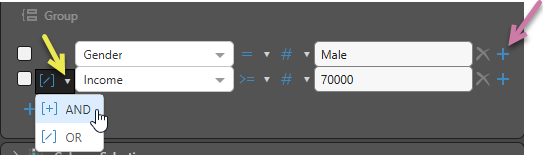
Note: If you select Plus alongside a row that is part of a group, the new rule will be added to the same group.
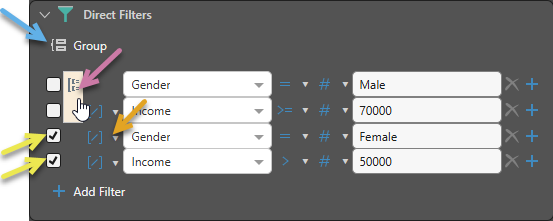
Group Conditions
If you want to group conditions together:
- Select the checkboxes for the conditions that you want to group together (yellow arrows below).
- Click Group (blue arrow) to group the columns.
- Click Ungroup (purple arrow) to remove a group that has been created.
Tip: As well as joins between the conditions, as described previously, you will also need to create joins between the groups (orange arrow).
Column Selection
Expand the Column Selection panel to update the column selection for the given table. By default, all columns in the table are selected but you can remove columns by clearing their checkboxes. Columns that have been deselected will not be copied to the new data model.
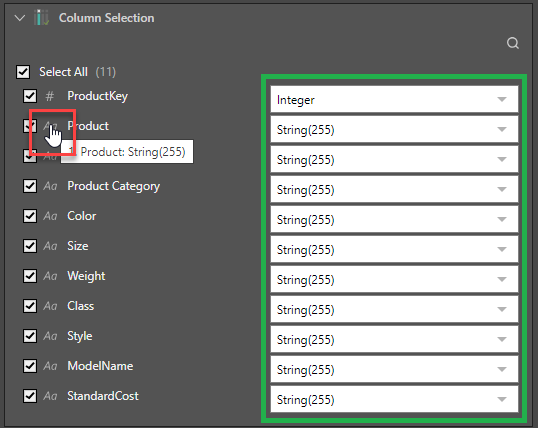
- Select All / Select: Select those columns that you want to copy to the new data model.
- Tooltip: Hover your cursor over the data type icon to see the tooltip describing the column number (starting at 0), the column name, and the data type.
- Data Type mapping: Type or select your required data type using this combo box (green highlight). Updating this value changes the data type for the selected column before it is passed on to the next node or the target. This mapping option is typically only relevant for file sources.
Note: The data type for String(N) indicates a string length "N." The data type for Decimal(P,S) indicates the number of digits "P" and decimal places "S."
Example: You may want to use this mapping if your spreadsheet only includes numeric zip codes. In this situation, the field will be detected as being an integer because of its content, but since zip codes can also include letters, you should use this combo box to change the data type to String(255).
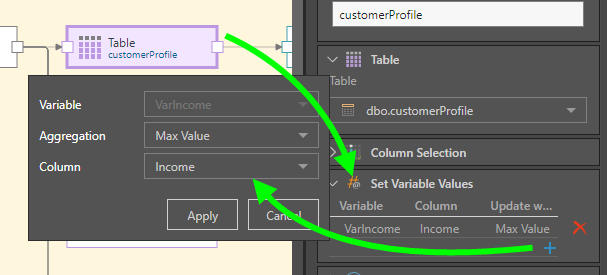
Set Variable Values
Expand the Set Variable Values window to pass a variable to the node. To do this, click the plus sign and then select the relevant variable, the aggregation type, and the relevant column.
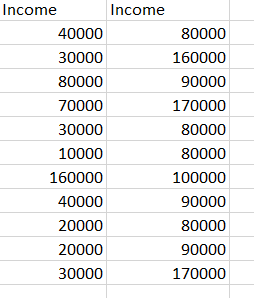
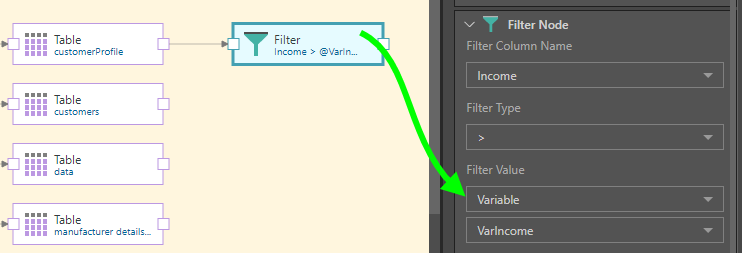
In this example, the table contains the income column on the left in the image below. We want to create a variable that will be used to load only rows where the income was 75000 and above (as in the column on the right).
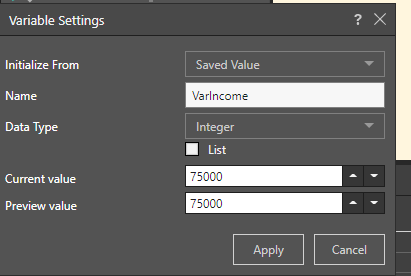
To accomplish this, a variable is created named VarIncome, where the value is set to 75000:
This variable is then injected into the table node where the Income column is located:
Finally, the Filter node is connected and used to filter the table by the Income column, using the variable:
Metadata
Expand the Metadata panel and add the following metadata details.
Description
Add a description for this node. This is useful for keeping track of the Data Flow (ETL) process, especially if multiple users are working with the same Data Flow. The description is visible only in the Model app.
Validate
If you do not want to validate this node when you run the validation process, for example because it is under construction and temporarily contains some invalid scripting, you can clear the selection of the Validate checkbox. Recommended: Always leave the Validate checkbox selected.
Node ID
The unique ID for this node. Click the Copy icon to copy this ID to your clipboard.